GED VIZ: An HTML5 data visualization tool
Good visualisations are more than just fancy graphics. They are a lot about storytelling, shedding light on important issues, and at the same time inspiring us to raise new questions.
Building such visualisations can be a very time-consuming effort, mostly requiring hand-crafted creative input. Consequently, we’re looking for ways to generate such visualisations without being experts in visual design, which in turn could make data even more accessible. We've written another blog post about the technical implementation.
When the Bertelsmann Foundation, a well-known German non-profit organization and think tank, investigated the relation between the European states during the time of crisis, they found an inspirational visualisation in the New York Times, called “Europe’s web of dept”.
However, this was just a static graphic with no way to interact, add data or watch data change over time. The Bertelsmann Foundation saw a lot potential in building a tool to create interactive visualisation of economic and demographic relations between states and unions. The GED project “intends to contribute to a better understanding of the growing complexity of economic developments”.
After a long ideation and design process with Boris Müller and Raureif, they approached us to build this tool with whatever feasible with state of the art technology. Some time later, we’re very proud to introduce the GED VIZ tool which was finally released on July 2nd.
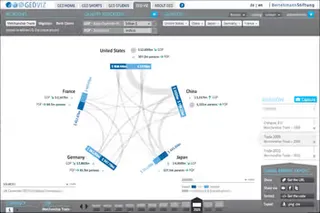
GED VIZ is a complex HTML5 application that runs right in the web browser. Using the editor interface, you can create slideshows of interactive charts that visualize economic indicators and relations of countries and their change over time. The slideshows can be embedded into other websites as well. For example, a news site or a blog can embed the visualization into their articles and comments. Users can also share and export the visualization or download the raw data.
On the GED website, there are several articles enriched with interactive visualizations. The following presentation illustrates the story “Shutting Out the BRICs? Why the EU Focuses on a Transatlantic Free Trade Area” by Justine Doody.
To get started with the tool, you can watch the tutorial video on YouTube:
Under the hood, GED VIZ is made with open web technologies. It is a large-scale client-side JavaScript application using our Chaplin.js architecture. On the server side, there is a Ruby on Rails application crunching the data which is stored in a MySQL database.
GED VIZ is a free online tool you can use without prior registration. It is also an open source project. The full code was released under the MIT license and is available on GitHub. We invite everyone to study the code and advance the tool, for example by adding new data sources and new abilities to tell stories.
GED VIZ is our latest take on data visualization using state-of-the-art web technologies. We hope that GED VIZ will be used to create impressive and insightful presentations. Many thanks to the GED team at Bertelsmann for letting us create such an application and release it as an open source project. Also thanks to the designers, testers and prototype developers involved!

