How we built the data visualization tool GED VIZ
Last week we released GED VIZ, a tool to create data visualizations for the web. It’s free to use and also open source!
See the announcement for general information.
GED VIZ is a large JavaScript (“HTML5”) application that runs in modern web browsers. It’s made using open web technologies: HTML, CSS, JavaScript and SVG. In this follow-up post we’d like to elaborate on the technical implementation.
App structure
The app basically consists of two interfaces, the presentation editor and the presentation player. The editor should be used full screen since it’s rather complex and powerful. The player however can be embedded into other web sites using a rather small iframe, but it has a full-screen feature, too. It needs to be robust so news sites and blogs can embed visualizations that work on every browser. We achieved that goal using progressive enhancement.
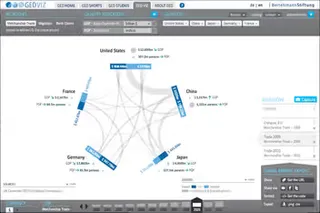
Presentation from the screencast “Asymmetric Globalization”.
Client side JavaScript app
The client-side part is written in CoffeeScript, a programming language that compiles to plain JavaScript. Most components are CoffeeScript classes. For modularization and dependency management, we’re using the Asynchronous Module Definition (AMD) and Require.js/Almond.js as a module loader. All JavaScript files are compiled into a big resource that is loaded once on application start-up.
To organize the code, we’re using the client-side MVC framework Chaplin.js, which is also an open source project by 9elements. We’re not using all cool features of Chaplin in this app because there are just two main screens. But we’ve successfully applied the Chaplin memory management to the chart components (DisplayObjects).
The main visualization uses Scalable Vector Graphics (SVG) that are dynamically created using Raphael.js, a low-level library for drawing SVG primitives. In older IE versions (IE < 9), Raphael uses Microsoft’s proprietary VML technology to render the chart. This is neither nice nor fast, but it works.
We’ve written a proper component and state management on top so the chart components can be updated with new data and transition smoothly. The data binding works similar to D3.js, but it’s so custom that D3 wouldn’t have helped much. Also, we need Raphael as a SVG/VML abstraction layer anyway.
If the browser supports neither SVG nor VML properly, we render a static non-interactive bitmap using PhantomJS, a headless WebKit browser that runs on the server. This way, the player is compatible with even with Stone Age browsers like IE7. The static images are also used for slide previews and for the export feature.
Server-side Ruby on Rails app
The server-side part of the application is written in Ruby on Rails, our favorite web application framework. For rapid frontend development, we’re using the well-proven stack HAML, Sass/Compass and CoffeeScript. Rails is a excellent foundation to write JavaScript applications on top: The Rails asset pipeline compiles the CoffeeScript code and bundles the AMD modules.
The server part in Ruby mostly crunches data and sends a JSON response to the client. The data is stored in a conventional MySQL database. We’re using complex SQL queries to optimize the calculations.
The raw data points are imported from CSV files into the MySQL database. Since all work data is static, it can be calculated once and then cached in using the file system or Memcached. There is no user authentication, so every presentation is public and accessible via its numerical ID (viz.ged-project.com/edit/<var>ID</var>). If you edit and save an existing presentation, a new one with a fresh ID is created. There’s a nifty feature that saves the current presentation draft in your browser using localStorage so you can leave the tool and come back without losing your work.
Challenges we faced
At 9elements, we’ve made several single-page applications and visualizations before, but GED VIZ is one of the most sophisticated JavaScript projects so far. It was challenging in many ways: designing a large-scale JavaScript application, building a complex user interface, processing lots of data, rendering a flexible chart with meaningful transitions.
It took several iterations and lot of fine tuning to achieve the current state. The final product is a cooperation with the Bertelsmann Foundation, Boris Müller and Raureif, who are responsible for the concept and design.
Next steps
Development hasn’t stopped. We’ve released the code as open source on GitHub. So how can you help?
Give feedback, report errors and propose changes.
Contribute improvements and new features by forking and modifying the code.
Add more or replace the existing data so the more types of visualizations are possible.
Translate the UI into other languages. Currently, it’s available in English and German.
Last but not least, we hope this web application inspires others to build even better visualization tools for the web!

